
What is Data Science?
Data Science is at its core the study of organising, exploring and analysing available historical information (data) to create useful and actionable insights. The science outlines interdisciplinary approaches, leveraging statistical, computer science and domain-specific knowledge, to handle data and arrive at reliable results of some scientific veracity.
Historically, data science has been interested in defining relationships between two or more variables and their interactions. That is, data scientists have looked to answer how some dependent variable Y reacts to changes in some independent variable X. The premise is that this relationship defined with some statistical confidence can allow us to change quantity X to control some outcome Y.
The Rise of Machine Learning
However, there has been a seismic shift in the way we think about data insights with the advent of Machine Learning (ML). ML is concerned with predictions. That is, how well variables X_1, X_2, ..., X_n can predict the variable Y.
This reduces our capacity to comment on how changes in some X_i will influence Y but in turn buys us strength in our capacity to comment on the value of Y given some observed combination of X = (X_1, X_2, ..., X_n). The framework essentially finds patterns in data and then leverages its knowledge of observed patterns to make predictions on new and unseen patterns.
Applications of Machine Learning
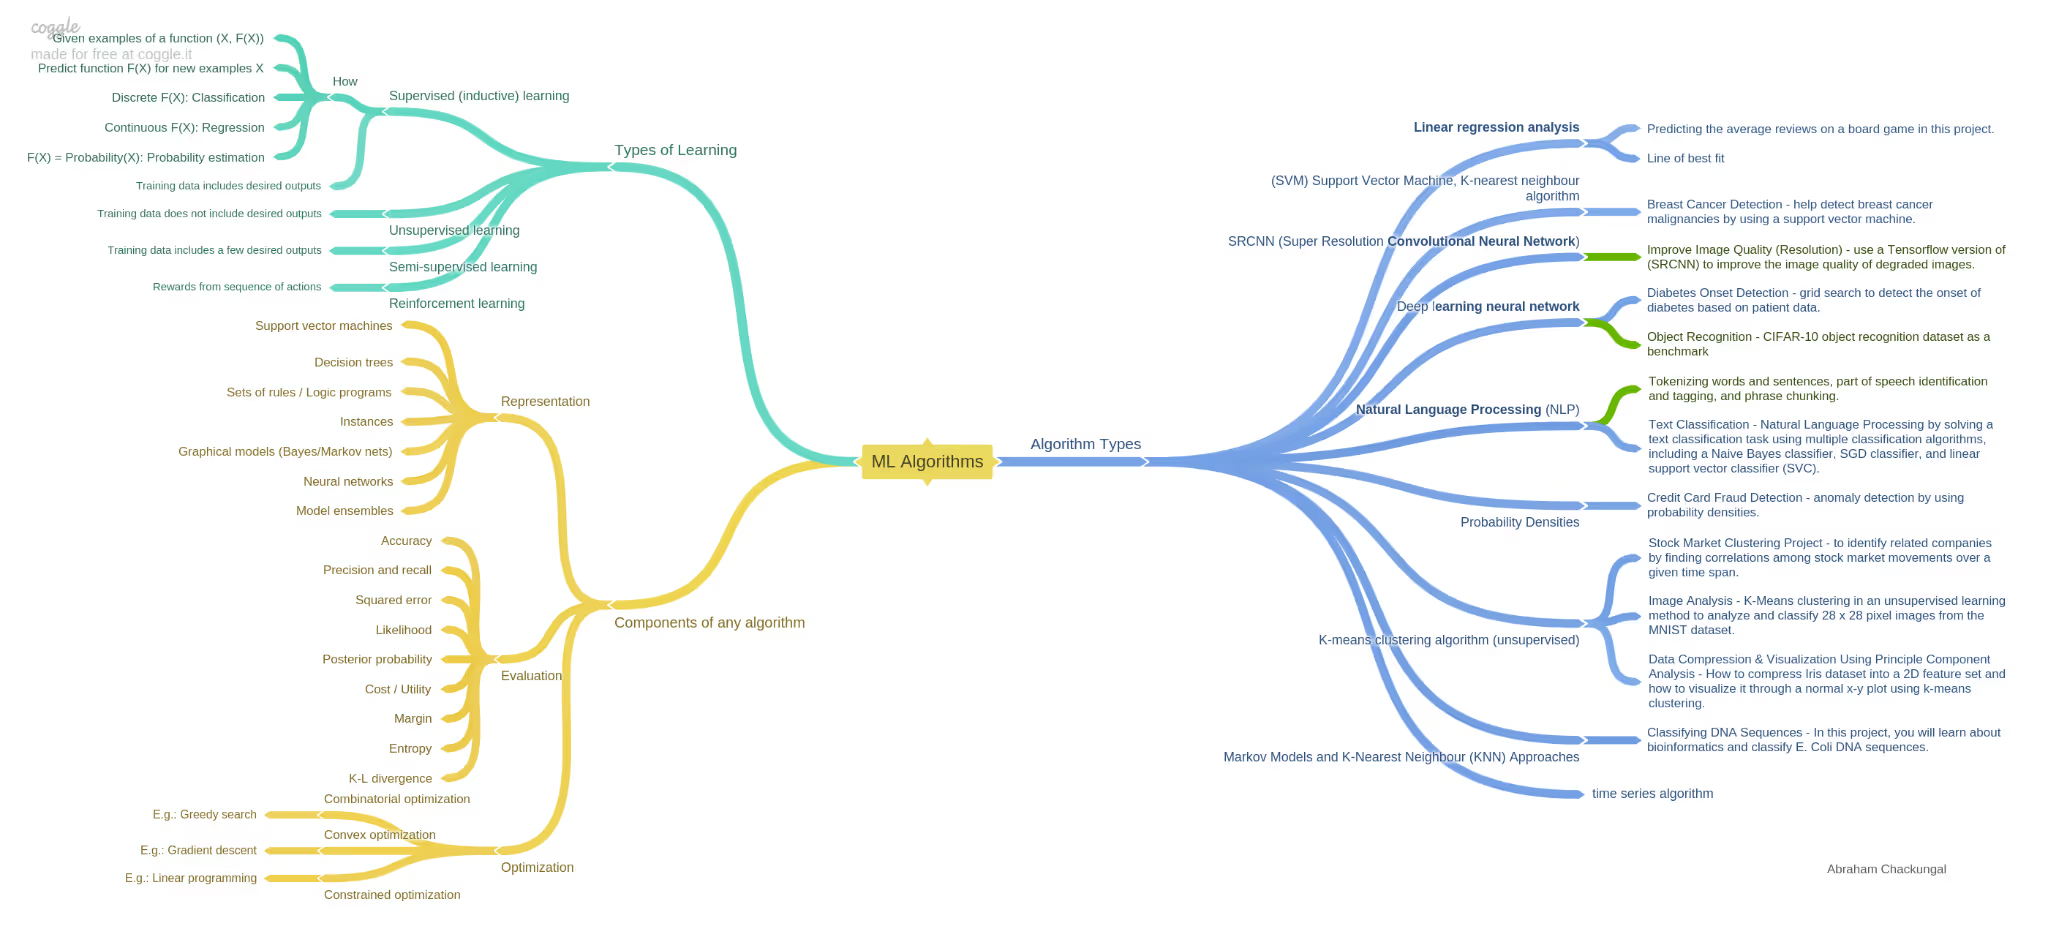
This simple paradigm has surprisingly vast applications. Simple linear regression models have been used for sales forecasting and logistic regression for predicting the likelihood of diseases such as diabetes and decision trees for crop yield prediction.
More sophisticated algorithms such as support vector machines (SVMs) were used in bioinformatics to classify proteins, K-Nearest Neighbours (KNNs) in early recommendation systems, Naive Bayes in sentiment analysis and Random Forests for land cover classification on remote sensing data.
It is clear that ML can deal with a large variety of data using a wide array of methods on a range of tasks. Data science is then the art of understanding the data and its associated domain to pick the most suitable representation for the data, objective and algorithm to solve for the objective to make strong statements about the data and the underlying domain.
The Data Science Pipeline
The general approach that machine learning adopts is the following pipeline:
1. Data Mining: Sometimes the data we receive is in the rawest form and the required input data needs to be abstracted from this raw set.
2. Exploratory Data Analysis (EDA): An often overlooked step but in general the most pivotal, herein is where we understand the nature of our data and also collect any theoretical insights about the associated domain. For example, for an image, we know that it comprises a grid of some defined resolution where every pixel in the grid has values ranging from 0-255.
3. Feature Engineering: Next, we must decide how we represent our data. This representation will then be a collection of our features. For example, if we have 3 colours red, green and blue we could give them some values 1, 2 and 3; however, this ordering is arbitrary but our models transmit some unwanted information. Hence, a better representation will be to "one-hot-encode", that is, create a vector of length 3 for which each position is associated with a colour and is 1 if the object is that colour and 0 otherwise. This is a simplified case of feature engineering. Still, often this is an essential step in ML and here is where a data scientist can introduce inductive bias from the domain understanding.
4. Model Selection and Validation: Another pivotal step is defining the model to use and validating it on the data to see its effectiveness. Usually, 3 and 4 are steps that go hand in hand and are a lot less linear as represented here.
The Deep Learning Revolution
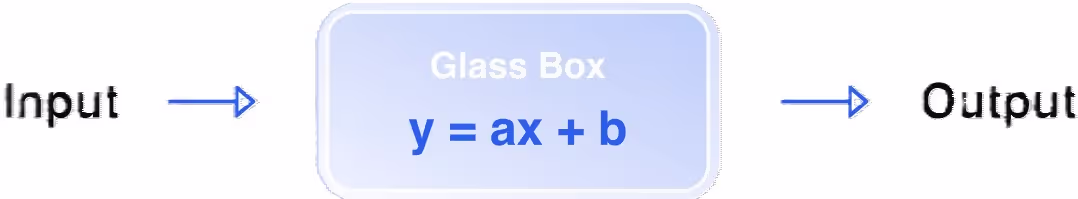
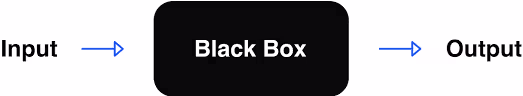
This is up to talk about the most exciting and newest addition to the set of tools under a data scientist's belt: Deep Learning. What makes this new tool so attractive, besides its seemingly fantastical achievements? Its expressive power.
Revisiting the ML pipeline, we declared feature selection and engineering as the most pivotal and artful steps for data scientists to perform. Essentially, deep learning performs these steps automatically through an optimisation task arriving at powerful latent representations for the imputed data. With this new representational prowess the final task, whether classification or regression, becomes astonishingly accurate.
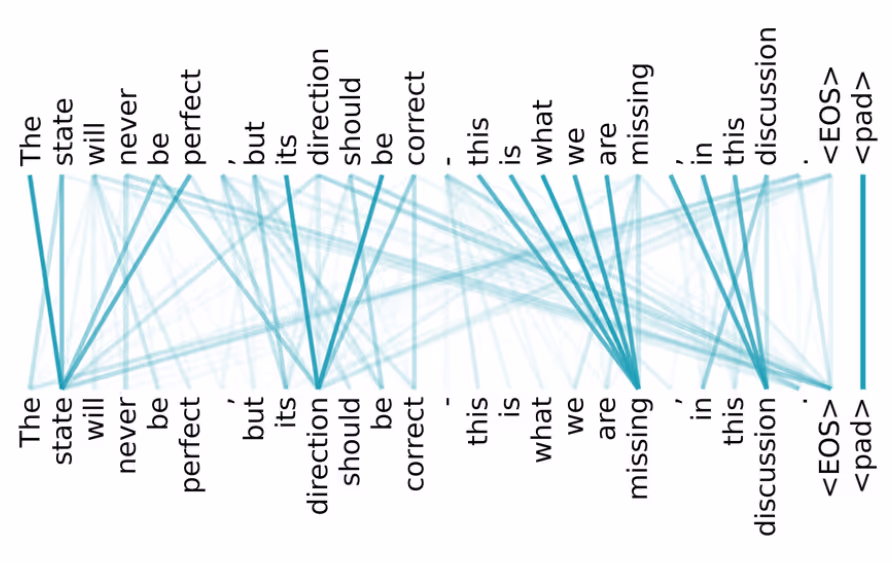
With this, DL allows us to tackle even more complex real-world data and consequently, applications. Take Large Language Models (LLMs) for example. There is so much information present in a single sentence. It contains words and each word interacts with every other word. LLMs are fundamentally able to unearth the patterns in these interactions between words by looking at a large number of sentences.
This is a daunting task; for perspective, a sentence of five words needs to account for 10 interactions, with 10 words this number is 45 and with 15 it is already at 105.
Data Representation in Deep Learning
This means that data science today is dealing with even more complexity and integrating domain-specific nuances in any application has become even more critical. Consider a set of points in a 3-dimensional space. The same data can directly be represented as points and use some clever architectures already established for point data (not included for the purpose of this article).
The 3D space can be divided into non-overlapping cubic windows and data can be aggregated for each point in the window. In this new 3D grid, well-established and cheaper Convolutional Neural Networks (CNN) can be applied, trading off granularity for performance. The same grid can also be converted into sequential data and processed with state-of-the-art transformer architectures.
The Data Explosion and New Gradient's Role
Currently, the huge boom in data science is the result of twin forces: the expansion of the data science toolkit as illustrated above and the availability of more data. Data is growing not only growing in depth, giving rise to notions of "big data", but also in width; new kinds of data are constantly being generated, organised and harnessed in the digital age.
An interesting example of novel data comes from the Harlem Shake fad that took the globe in 2013. The challenge unintentionally gave rise to 3D stills which are being used for many interesting computer vision tasks today such as 2D to 3D rendition models.
New Gradient is operating at this novel frontier of data science bringing DL techniques to industry use-cases that posit new data and exciting applications. We are using cutting-edge computer vision models in industries such as mining, quarrying, security and restoration; each industry bringing different nuances to image data and different use-cases.
Large Language Models (LLMs) are being harnessed and tailored for domain-specific scenarios for clients such as in question and answering and knowledge base querying.